
Introducing College Golf Data


Two years ago, Mikkel and I began exchanging DMs on Substack, geeking out over college golf postseason data. Those conversations grew into several joint writing efforts exploring the history and data of several college golf events.
We’ve recently taken our joint passion for the sport and turned that into a website. It’s new and exciting for us (and we hope for you as well), but we see this a just Phase I of building a resource for fans and even the teams themselves.
If you find this post a year or even six months from now, things might look very different as we continue to evolve the site, but the point of this post today is introduce folks to collegegolfdata.com and provide a guided exploration of our early offerings.


REGIONAL PREDICTIONS
Our first joint effort back in 2024 was exploring how advantageous it was for college golf teams to host a Regional, so that was a natural starting point for our new website. It’s also the driving force for the timing of the site coming online just before the announcement of the Regional selections for the 2025-26 season.
While the Regional site reveal that happens live on Golf Channel is an exciting event for teams and fans, the last few weeks of the season where teams secure automatic qualifiers and solidify their rankings - which is the primary determining factor for selection into the Regional field - produces under-appreciated drama. We’re aiming to provide a visual tool for people to track this throughout the season going forward.
As we go through each of these sections, keep in mind that we have selectable options to display Regionals info for either (D1) men or women.
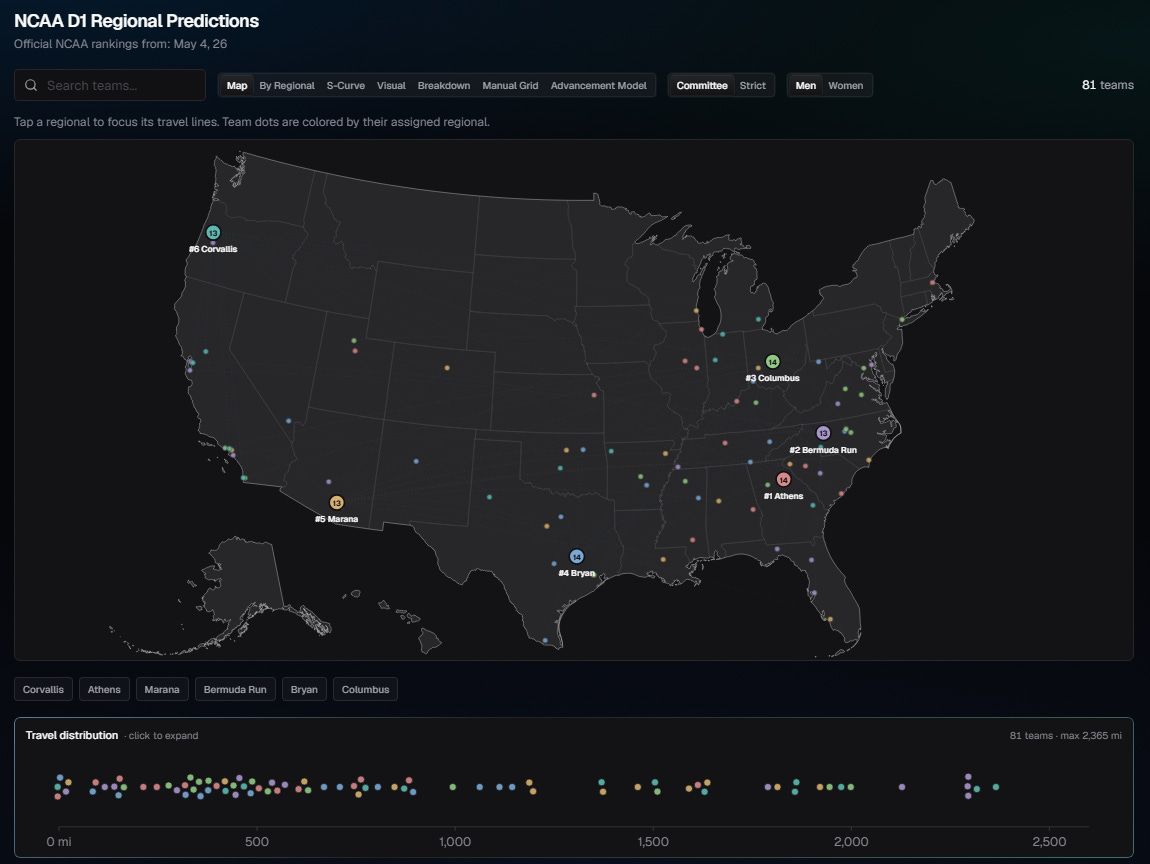
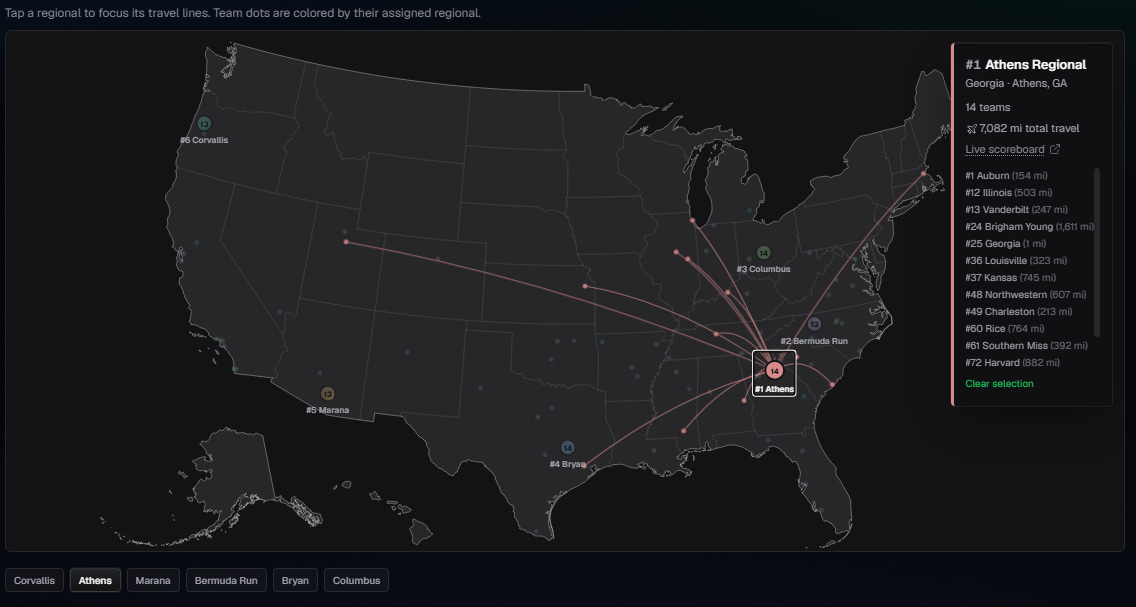
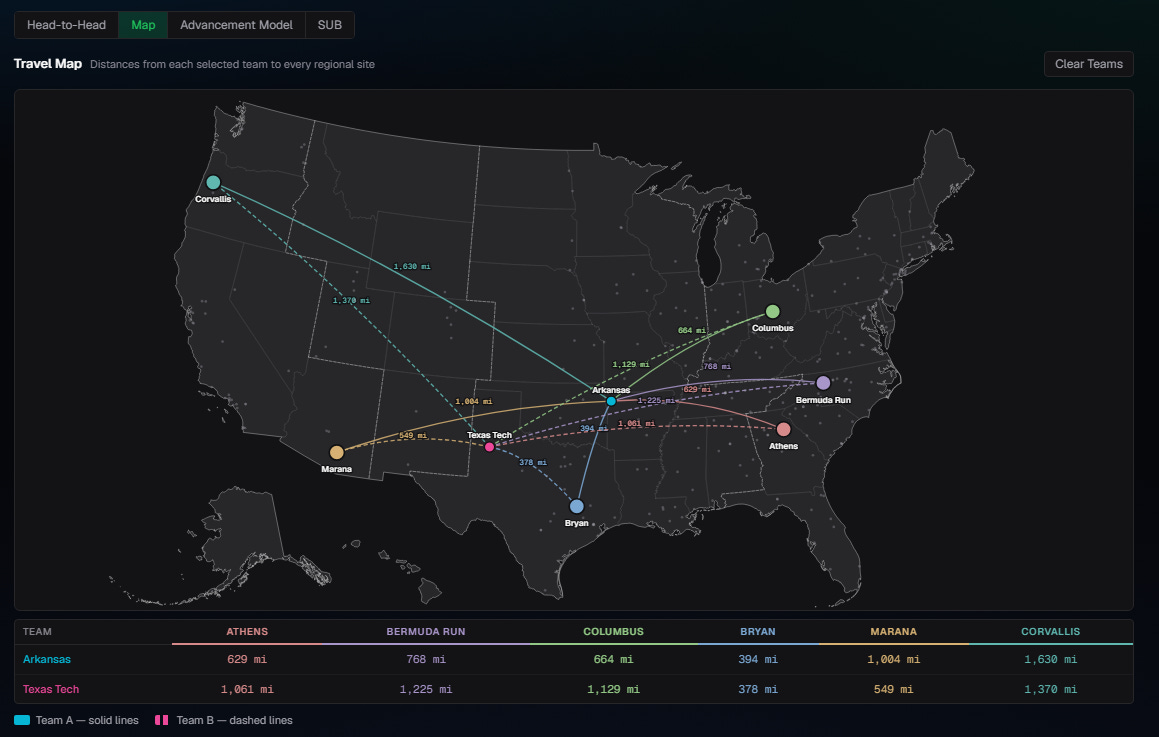
MAP
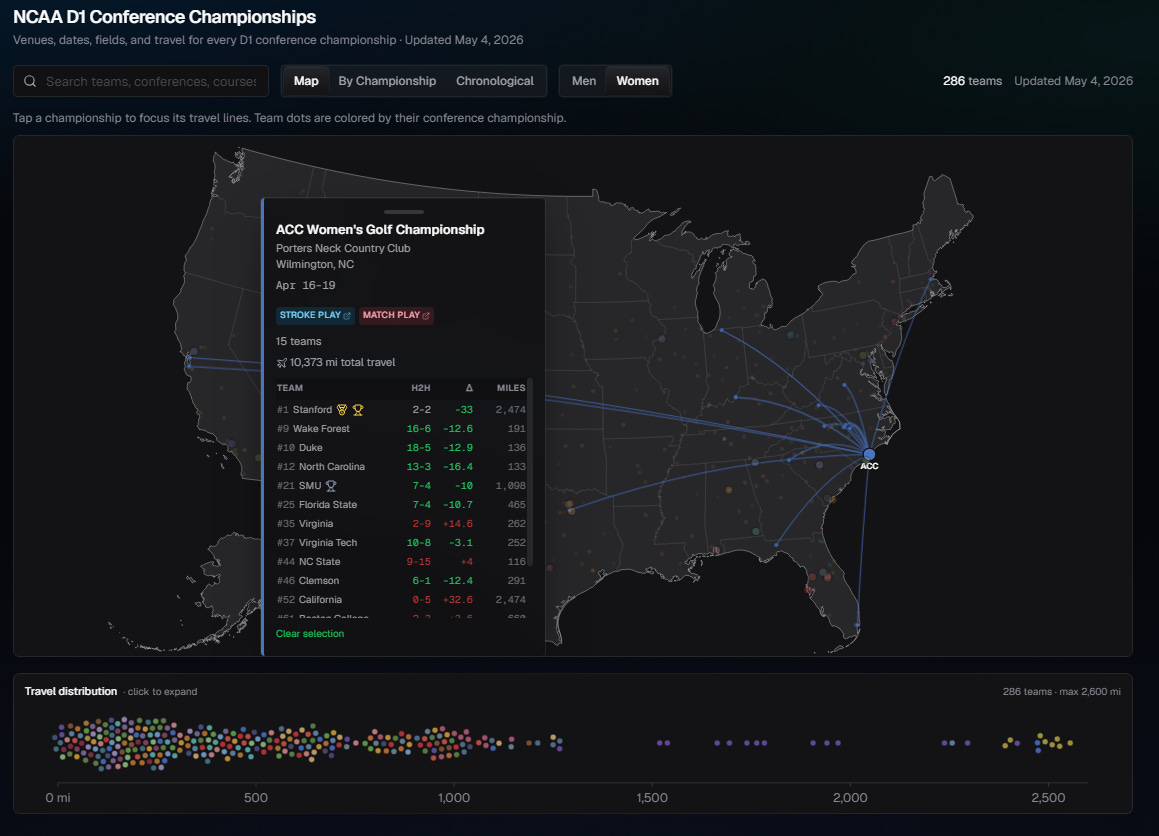
This map feature provides a cool visual to see where the teams are traveling from/to for their specified Regional. Selecting any of the provided Regional sites will display the lines connecting the teams to that site and providing travel distance.
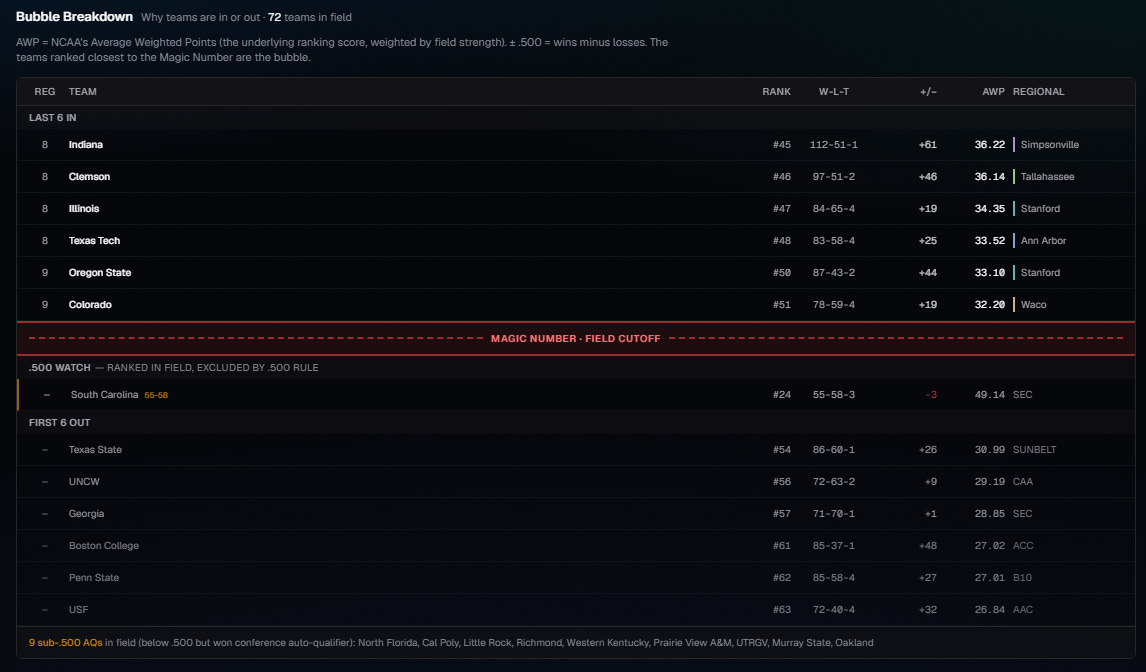
BREAKDOWN OF THE TEAMS
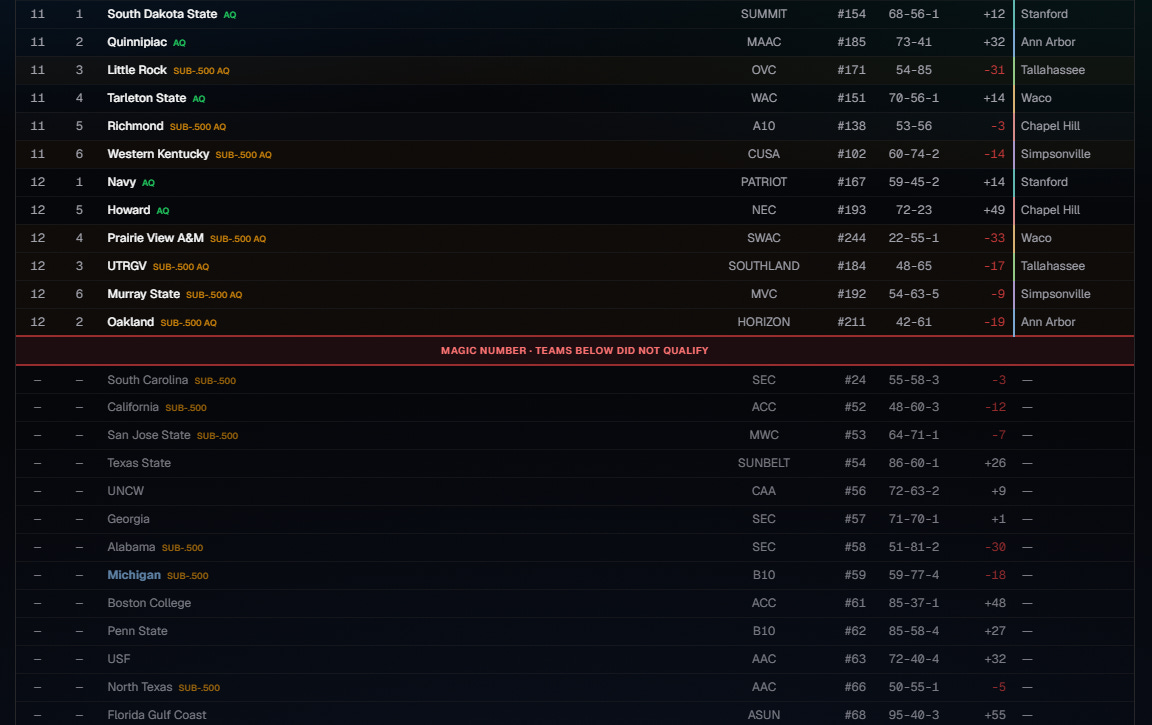
One of the unique aspects of our site is the capability to see a full breakdown of the teams and their relation to what is generally referred to as the “Magic Number” - a term coined by Golfweek’s Lance Ringler ~2 decades ago to indicate the final non-automatic qualifier (AQ) team in the rankings list. Much like NCAA basketball’s March Madness bracket reveal, we’ve provided a way to view the last 6 non-AQ teams in the tournament and the first 6 left out. Since there is a .500 rule in college golf - teams must have a winning record to receive an at-large bid - any of the non-AQ teams ranked better than the Magic Number are removed from that equation; however, we find that info is still worth displaying for clarity. We’ve also identified all of the AQ teams which had a sub-.500 record, but still earned their Regional berth thanks to winning one of the 29 conferences which receive an AQ.
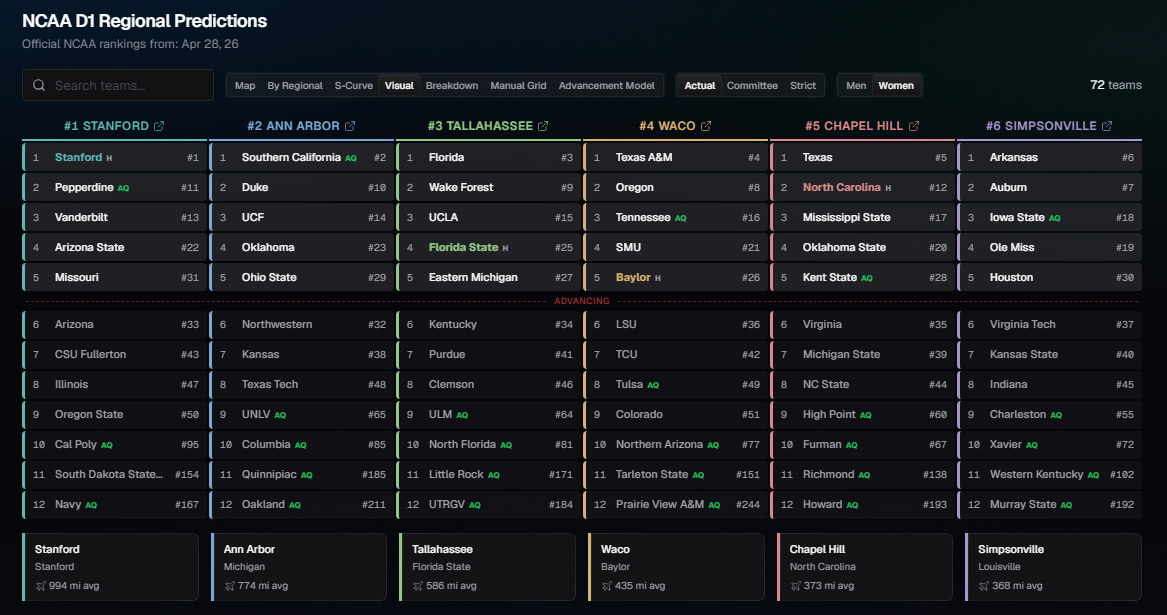
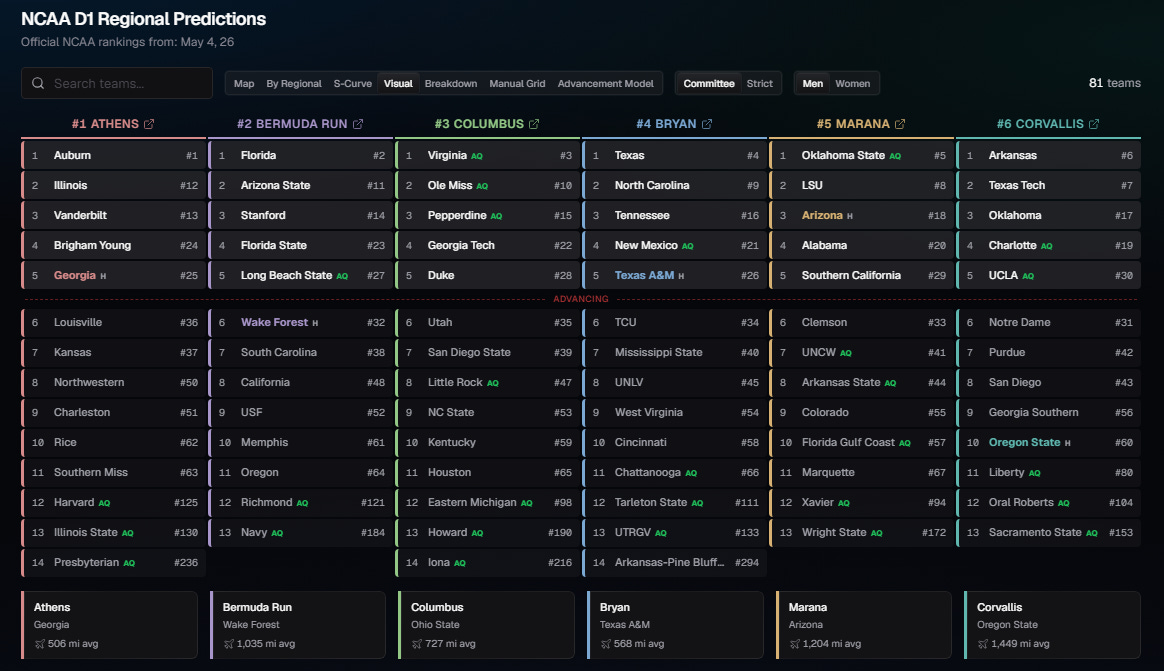
VISUALIZING THE S-CURVE
Now here is the really fun part. D1 college golf Regional selections are made by a Committee which generally uses the Official NCAA Rankings - supplied by Scoreboard (powered by Clippd) based on Prof. Mark Broadie’s algorithm - to build the official S-curve. The full Regional field of teams (81 men, 72 women) starts with all of the AQs and then fills in the remaining teams receiving at-large bids by going straight down the rankings, skipping any on the wrong side of the .500 rule. These teams are then placed into a snaking pattern beginning with the first six highest ranked teams as #1 seeds in the six Regional sites, and then moving down the list from there.
We’ve provided several different ways of visualizing this data, including seeing the S-curve generated based on:
the Strict method of going straight down the rankings list with no other considerations
providing some considerations that the Committee usually makes such as putting the host team in their own Regional and balancing the Regionals based on travel, strength, etc
the Actual s-curve once released by the Committee and revealed by Golf Channel
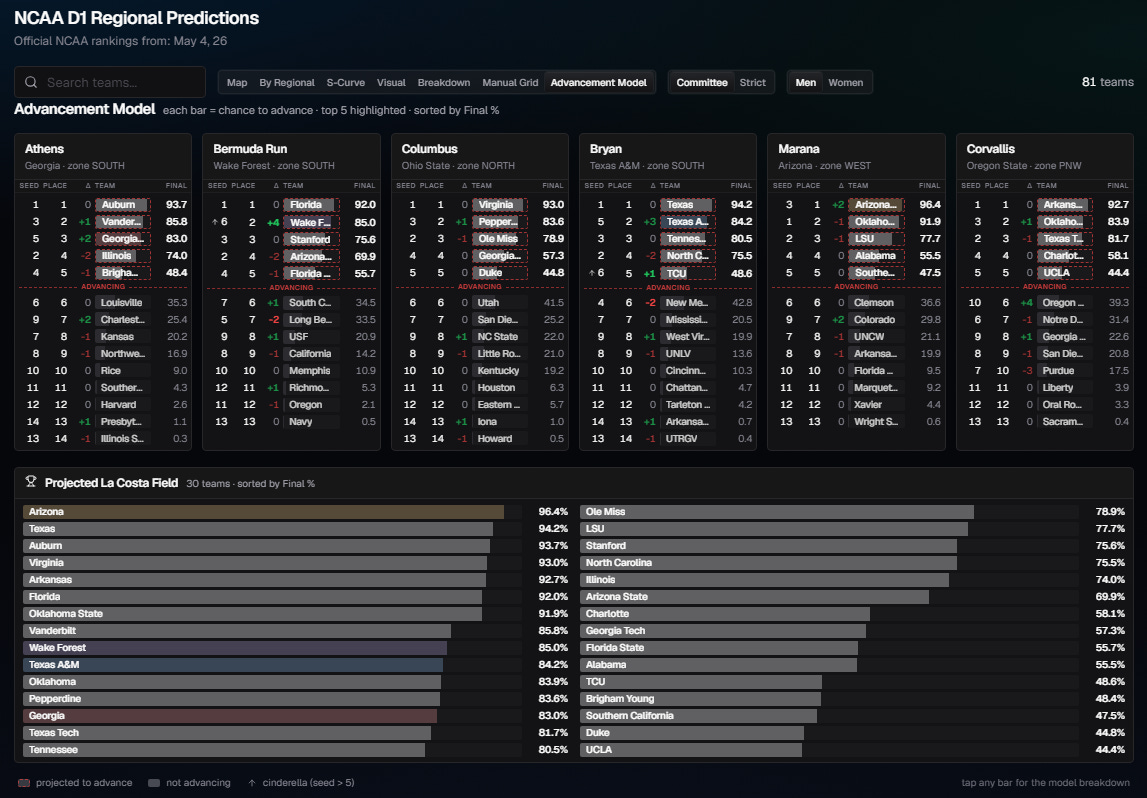
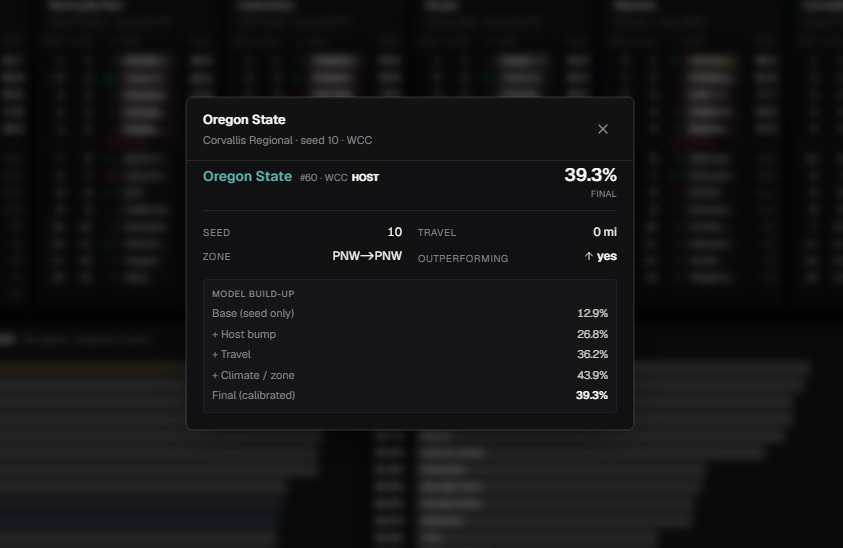
ADVANCEMENT MODEL
Our advancement model is the first taste of actual data analysis we’re doing on the site. Given all of the historical info gathered, we’ve come up with an algorithm that attempts to put a percentage likelihood of advancing through the Regional based on a number of factors outlined on the site. It’s important to note, however, that this is NOT (currently) adjusted to take into account any given team’s recently play, simply using past Regional results.
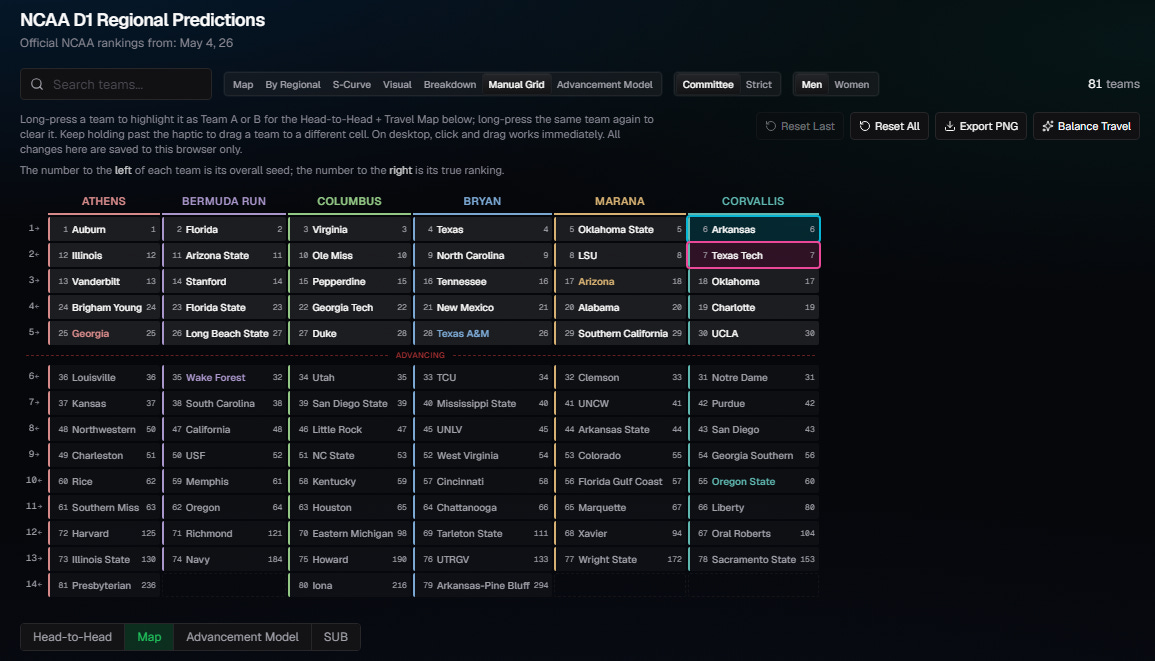
BE YOUR OWN COMMITTEE MEMBER
This is where we go a little off the rails, but this Manual Grid tool is (in David’s opinion at least) a solid 10/10 feature, which you are guaranteed not to find anywhere else. Ever thought “I bet I could build out the Regional S-curve better than the Committee”? Of course not...but that capability now exists regardless!
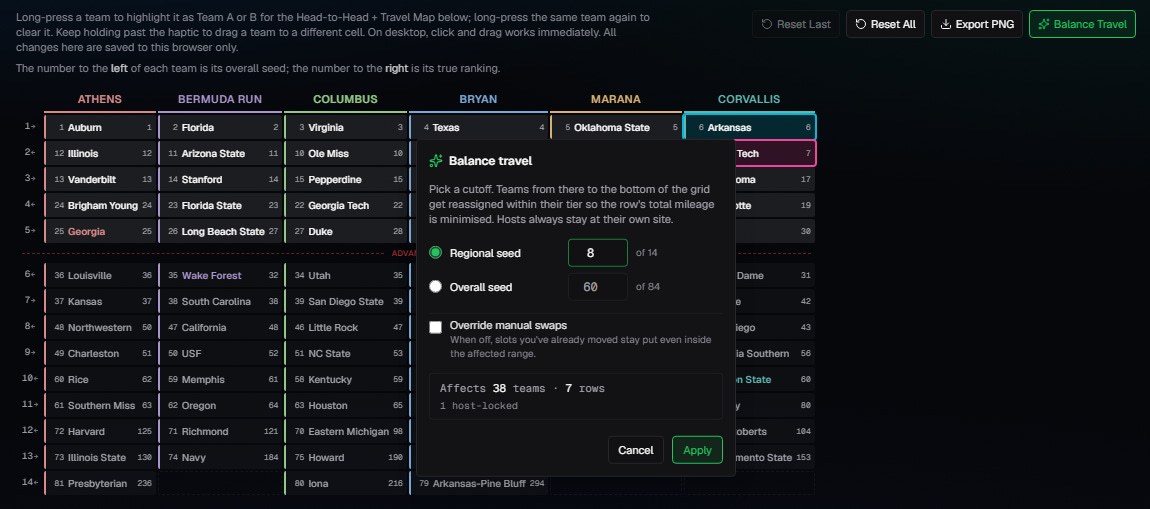
This tool allows you to drag and drop teams to any Regional site (or simply switch the sites themselves) and build the perfect grid. We’ve provided all of the additional info one might need to help make decisions: a map to see travel comparisons between two teams, a breakdown of head-to-head results (along with results against common opponents), a view of the advancement model that changes with the updated grid, and even the ability to project (or change reality) different teams receiving conference AQs or simply swap teams in/out of the final field entirely. On top of that, there is a travel balancer feature which can make it easy to dictate which seeds/teams get to see the least amount of travel possible.
This is your playground, enjoy! And once you’re done, you can download an image file of the final grid to share with everyone else.
CONFERENCE CHAMPIONSHIPS
With the conference championships determining the Automatic Qualifiers into the Regional field, it’s natural to want to follow along with those results.
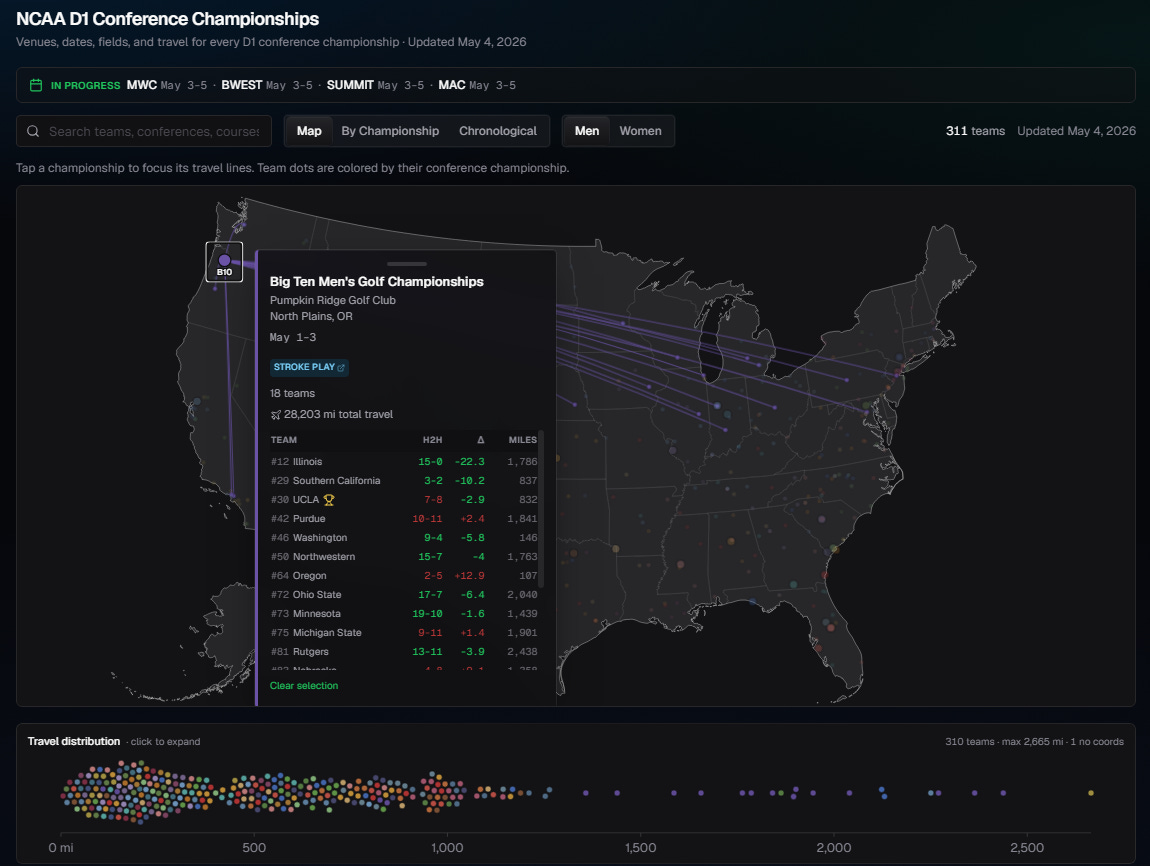
MAP
We saw a lot of value in showing the travel for teams going to the Regional sites and figured that would be beneficial for the Conference championships as well. This provided some really interesting insight which we’ll dive into at some point by examining travel such as the Rutgers men going from the Atlantic coast to the Pacific for the Big Ten championship, or the Stanford women going the opposite direction for the ACC championship.
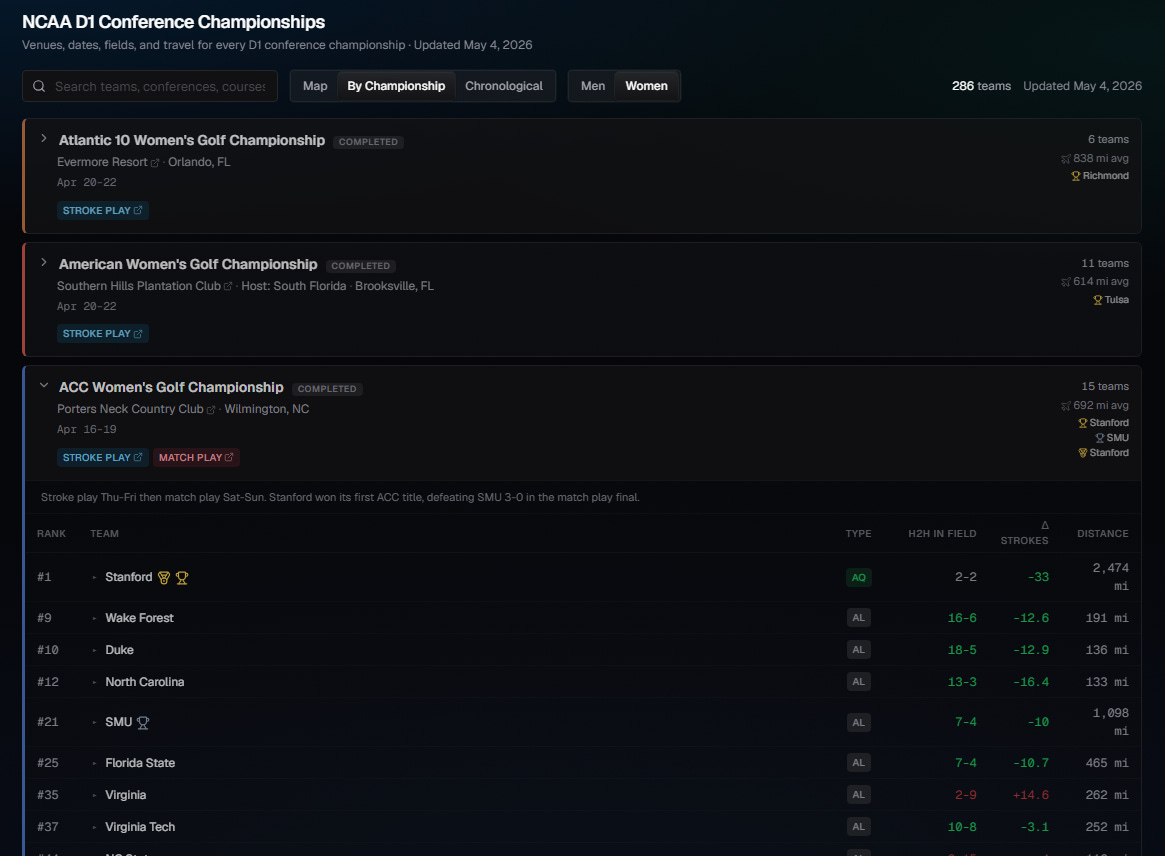
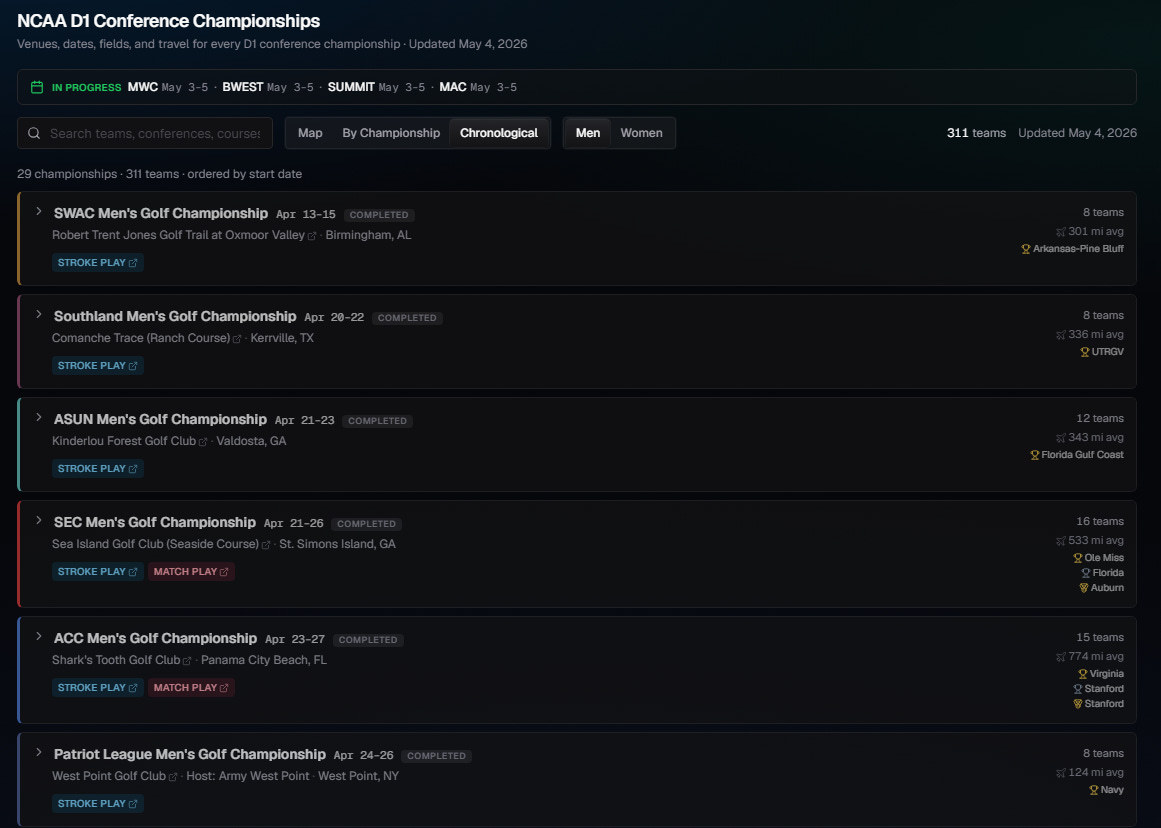
VISUALIZING THE TOURNAMENTS
Of course you want to also see the actual tournament results, so we provided two ways to get that info: alphabetically by the conference, and chronologically from when they were played. Each of these gives a breakdown of the Conference members (ordered based on their national rank which is how we determine the pre-tournament favorite), the site, the links to stroke play and match play portions, and indicators who won the AQ along with indicators of the stroke play medalist and match play runner-up if match play was a component of the championship.
REGIONALS & NCAA HISTORY
The data is cool, but sometimes you just want to see the actual postseason history. We wanted to find a fun way to showcase all of the past Regional and NCAA championship results, so we put them into a series of pages with info and leaderboards.
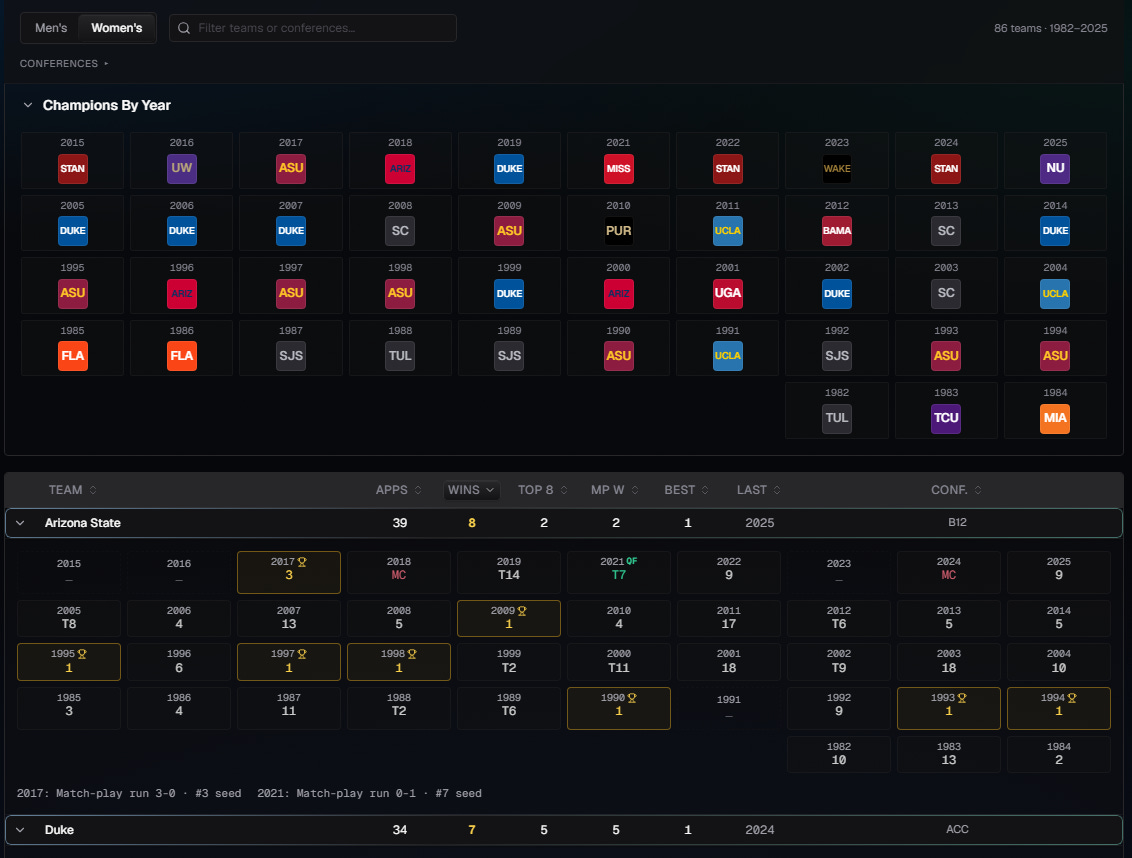
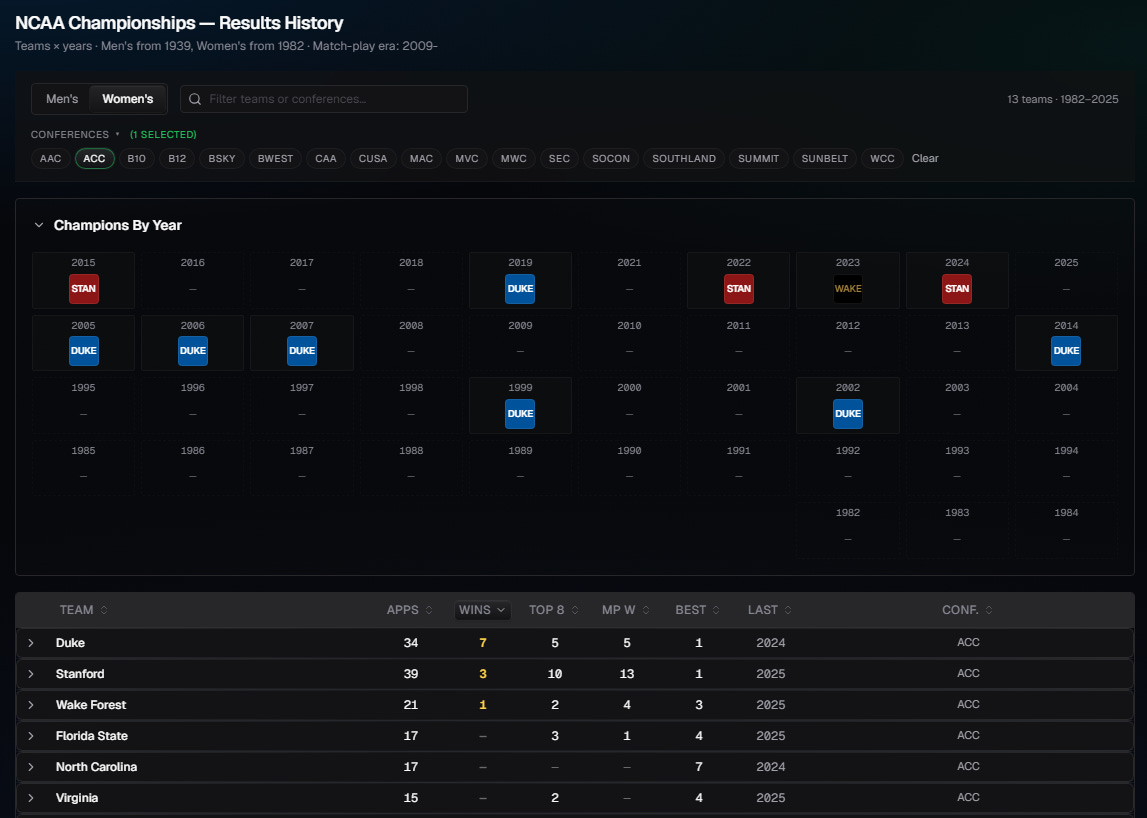
Keep in mind two things: all of the year-by-year team grids appear in the team pages too, and that there’s a little filter as well which can narrow the scope to any number of (current) conferences.
REGIONALS
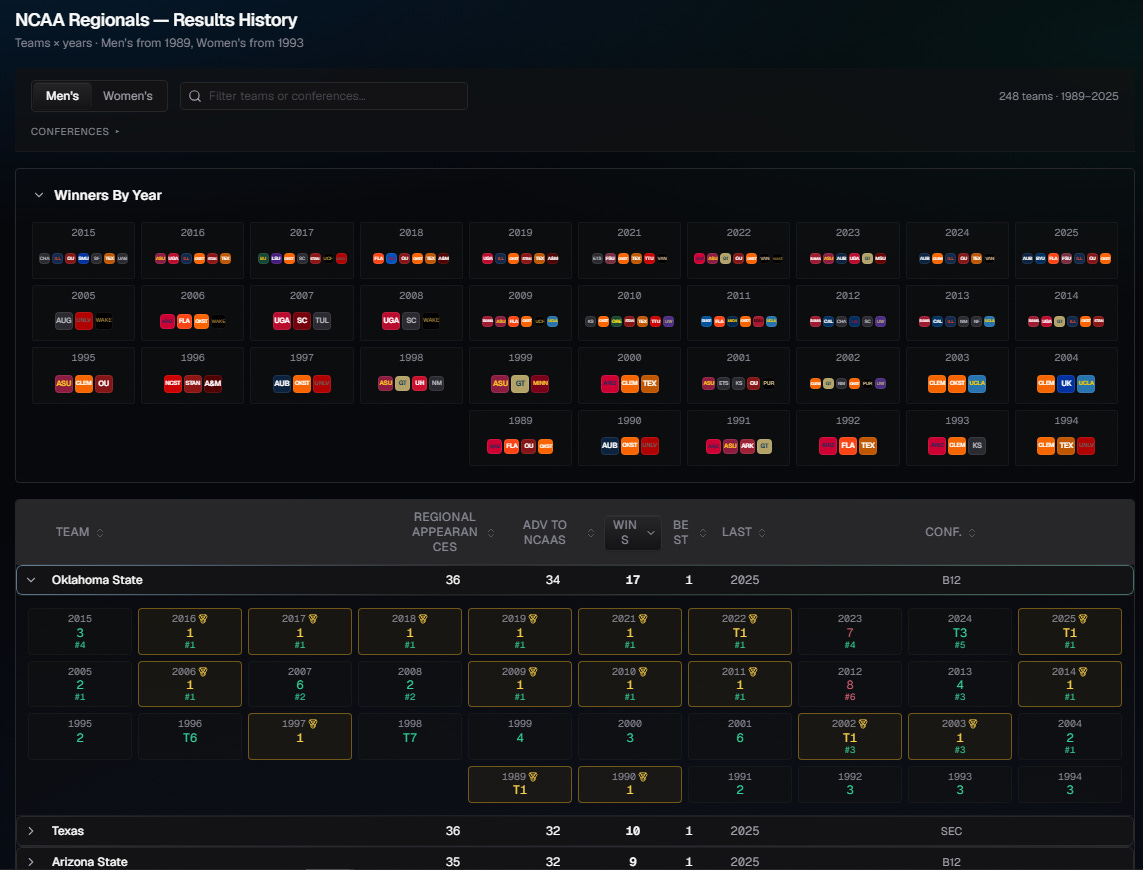
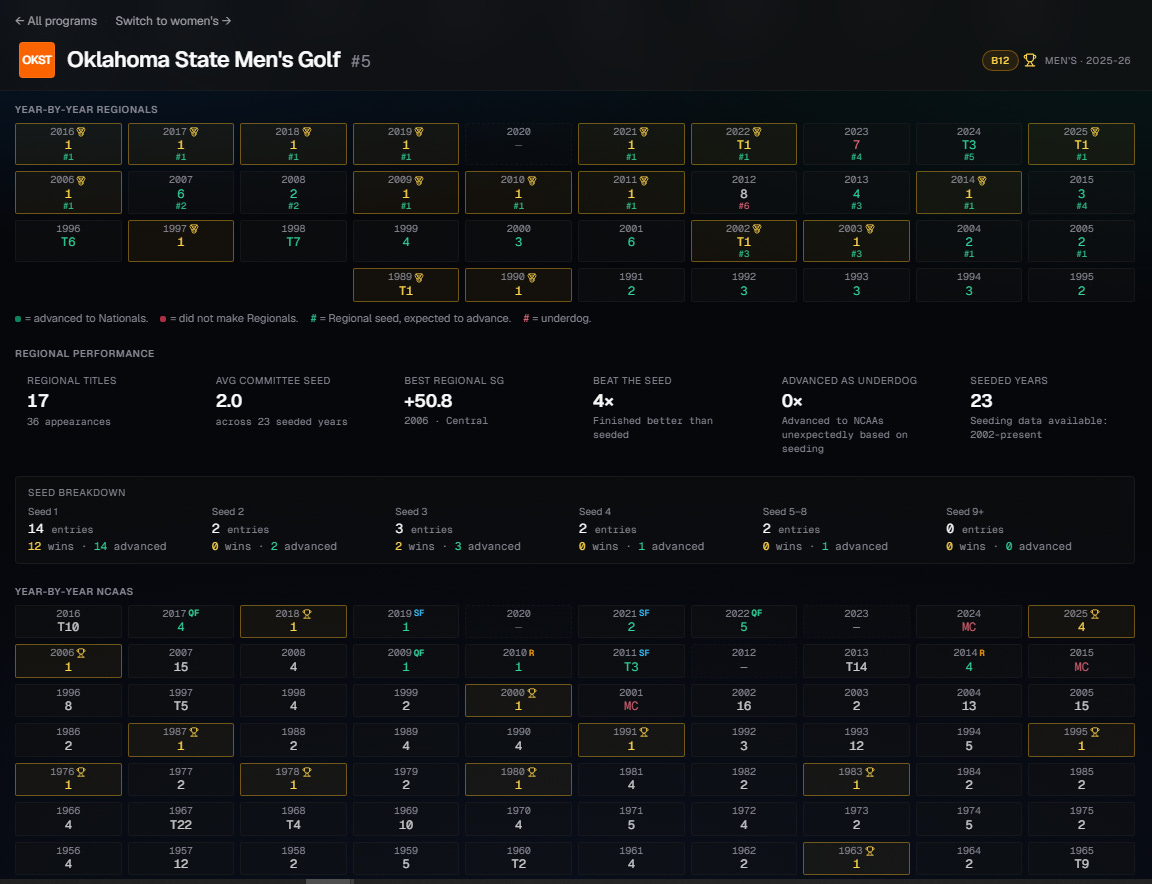
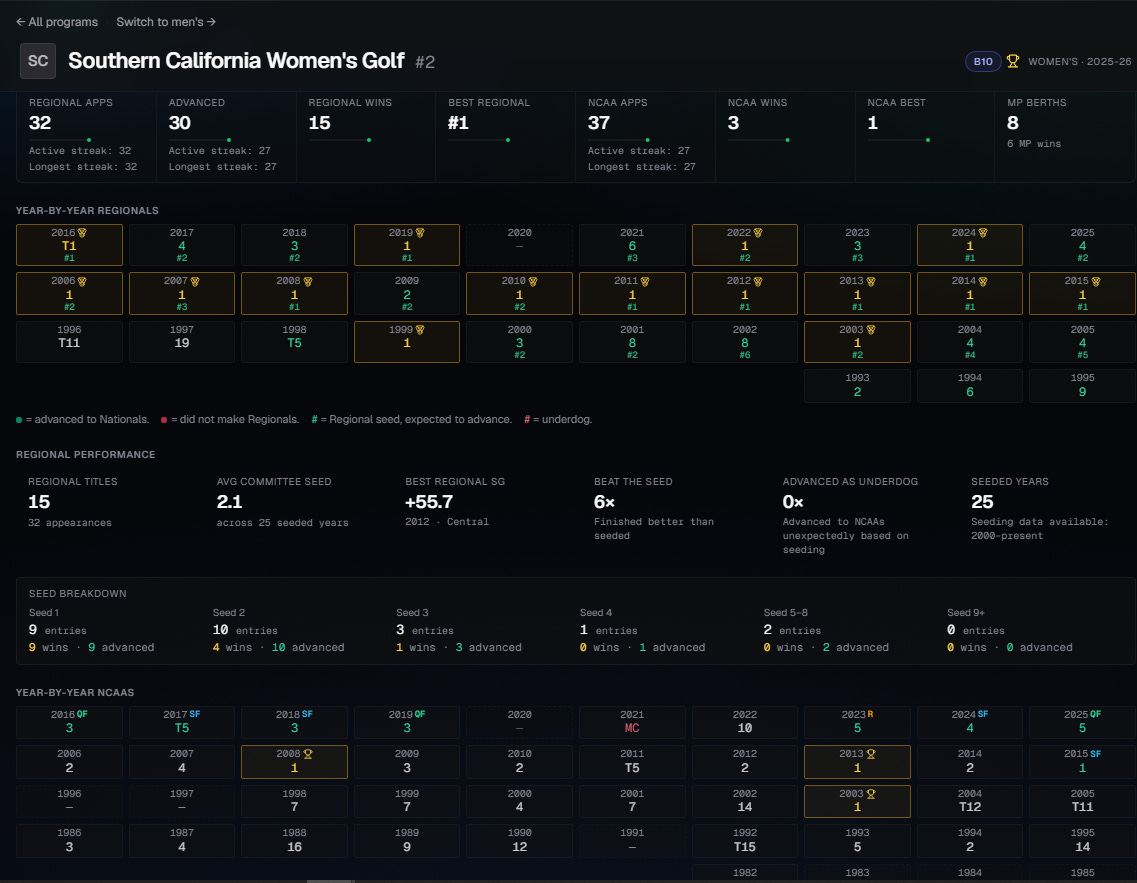
The Regional history for the men goes back to 1989 while the women goes to 1993, and the Regionals History tab provides visuals for the year-by-year winners. You can see data for the teams in terms of appearances, advancement to NCAAs, times won, and their last Regional appearance, and then expanding that team will provide their own year-by-year results. Click on the team name to go to their individual page.
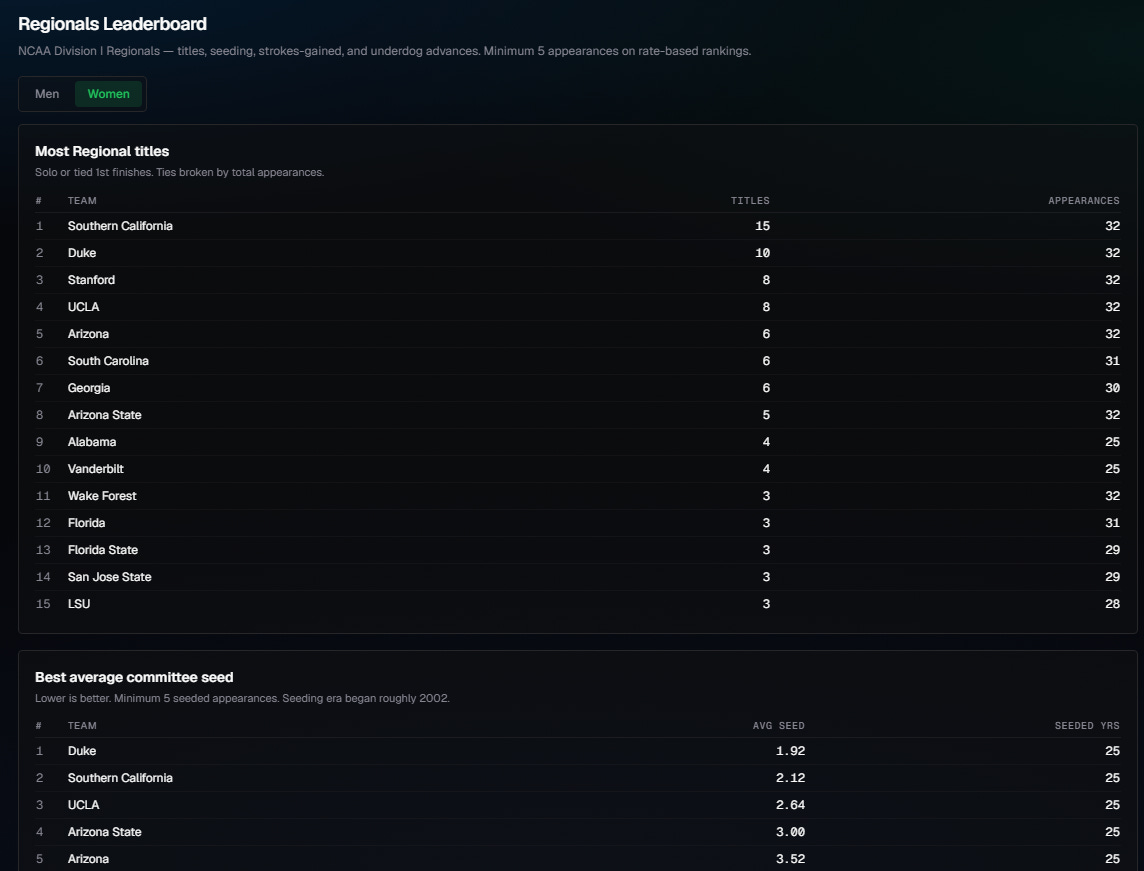
We also have a separate Regionals Leaderboard page which showcases the top 15 teams in a number of categories including wins, average seeding, and Strokes Gained (SG).
NCAA
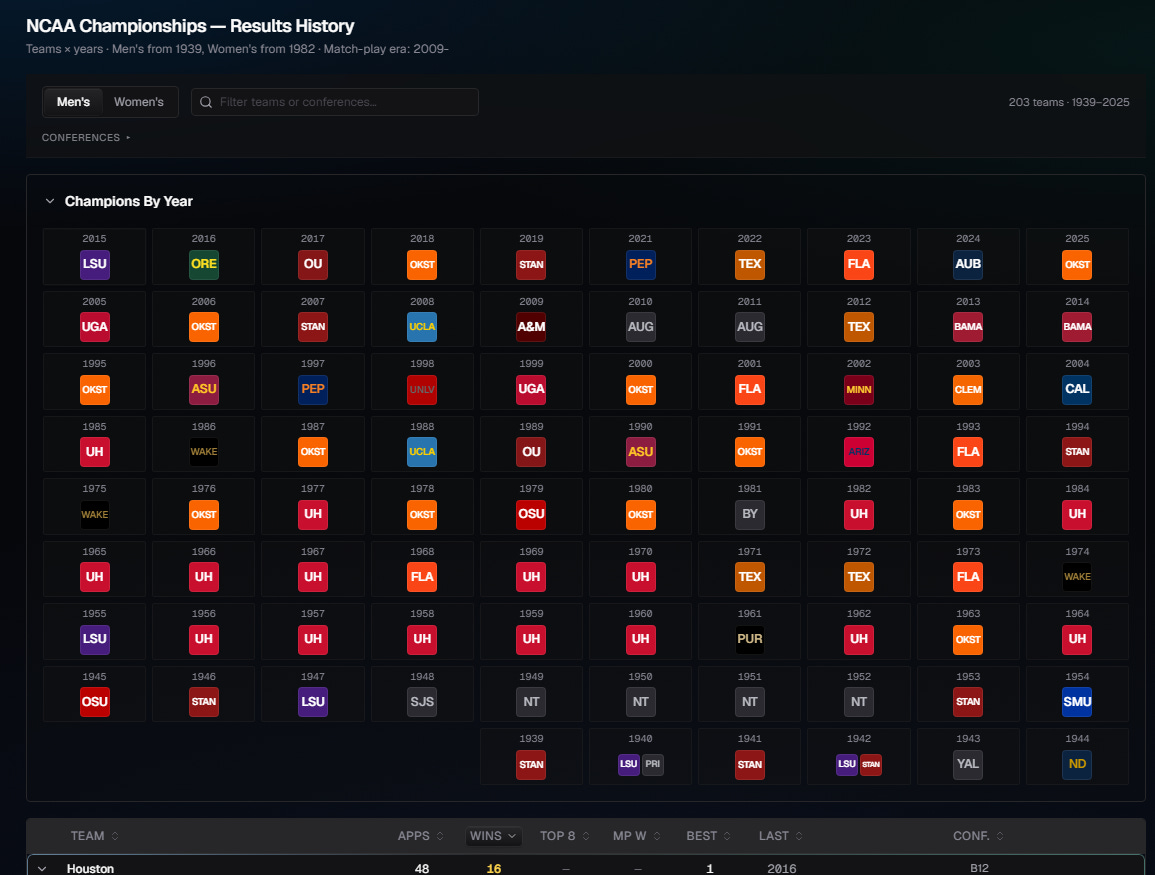
The NCAA Championships Results History page accomplishes the same thing as the Regional History page, but for NCAA results going back to 1939 for the men and 1982 for the women. We’re looking into ways to present the pre-NCAA results for both sometime in the near future.
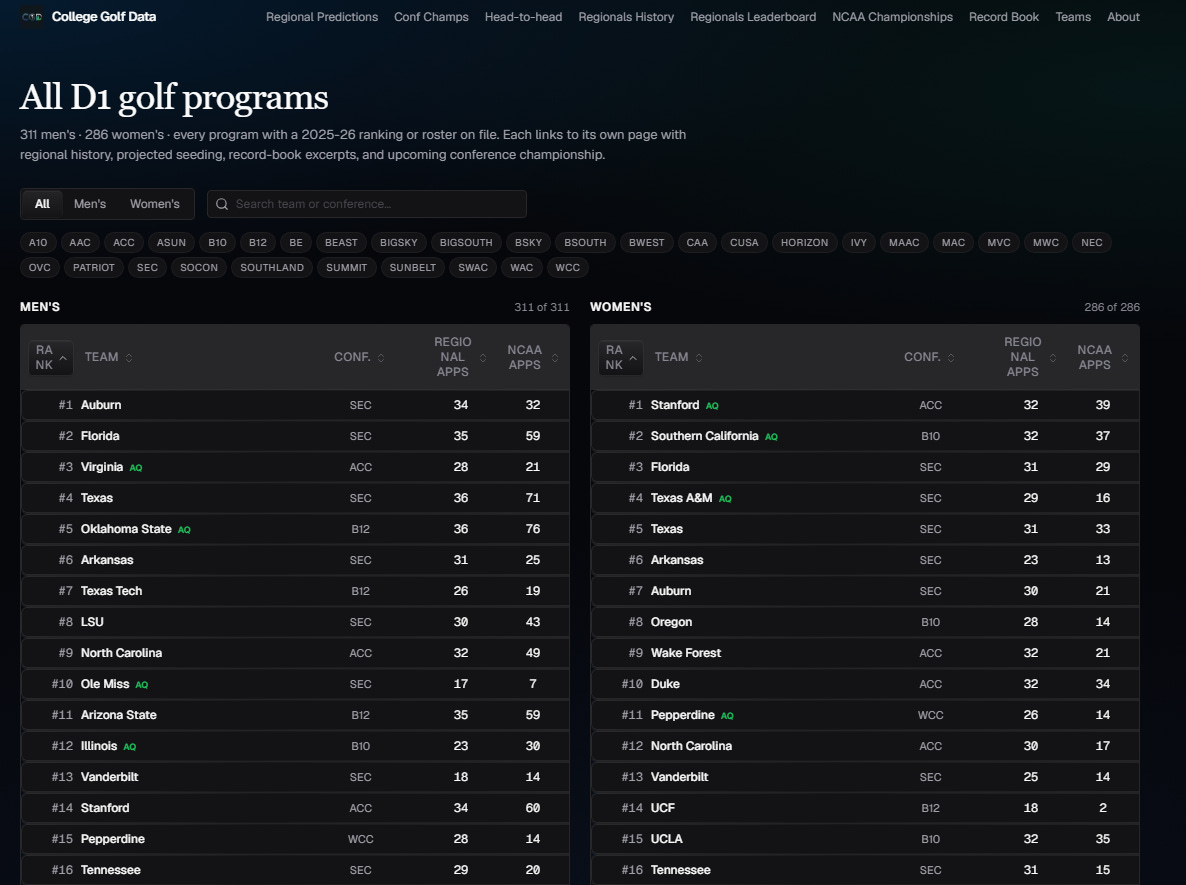
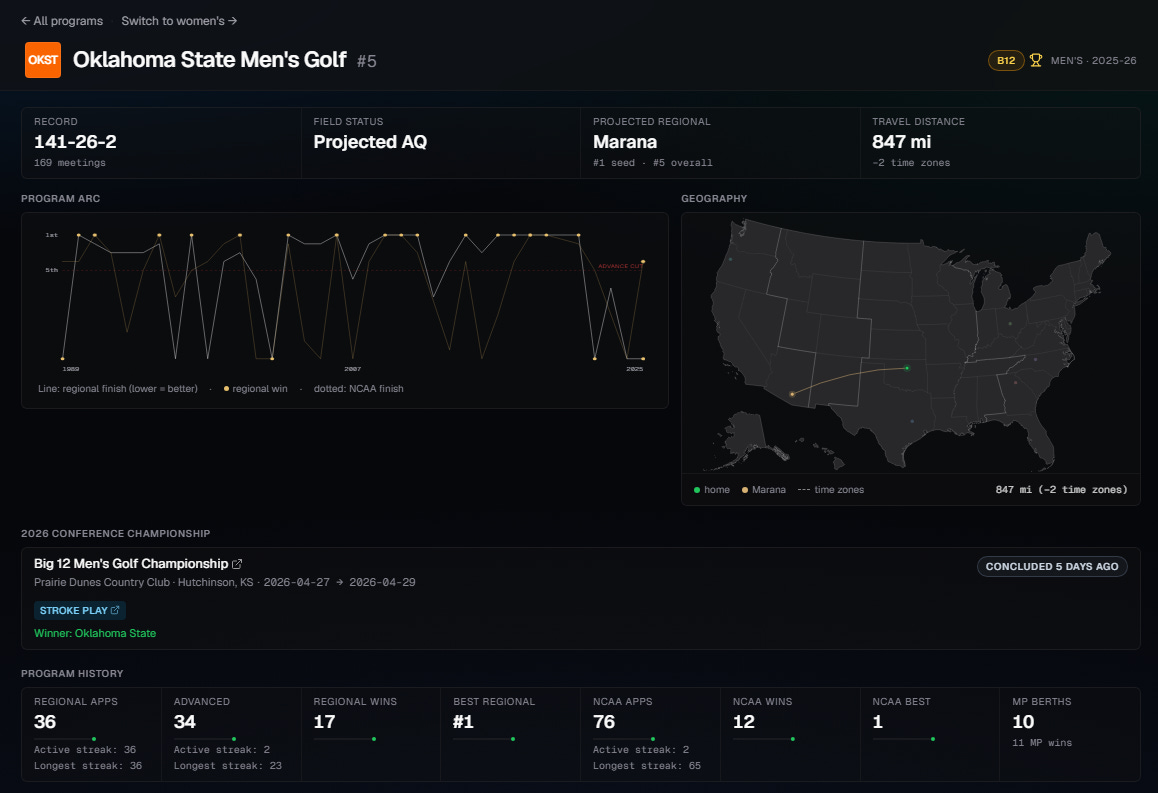
TEAMS
The individual team pages give detailed historical results in both the Regionals and NCAA championships, links to this year’s conference tournament, and even some of the records that appear in the Record Book (see next section). There are many places throughout the site where clicking on the team name will bring you to this page, however there is also a dedicated Teams tab where you can see them listed by their national ranking and can filter based on conference affiliation.
RECORD BOOKS
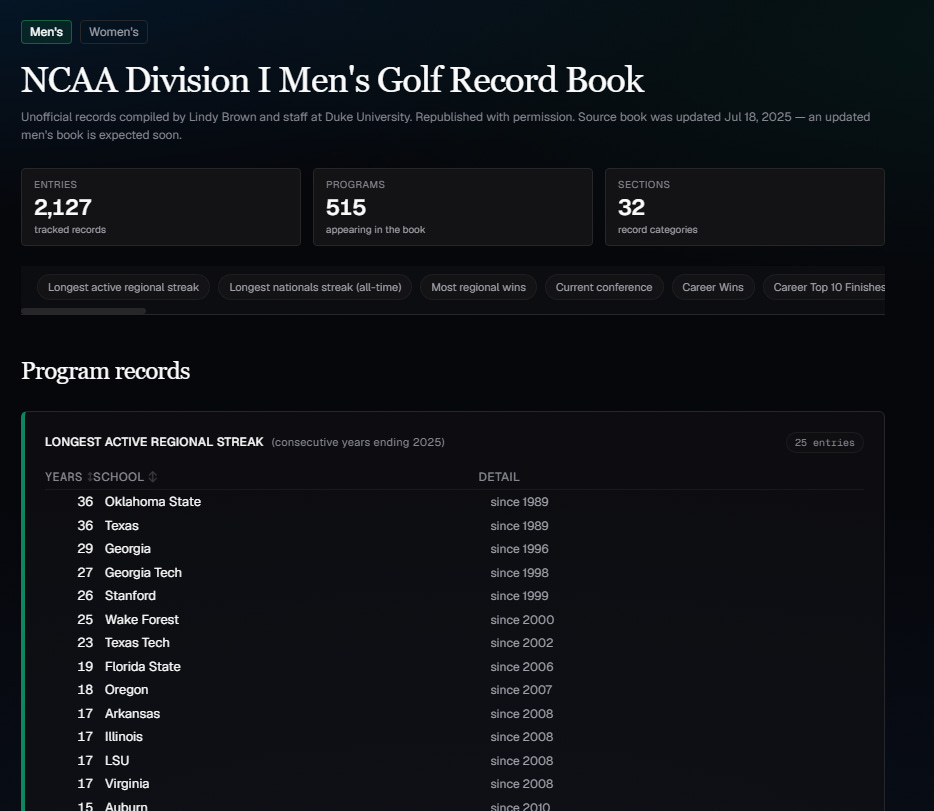
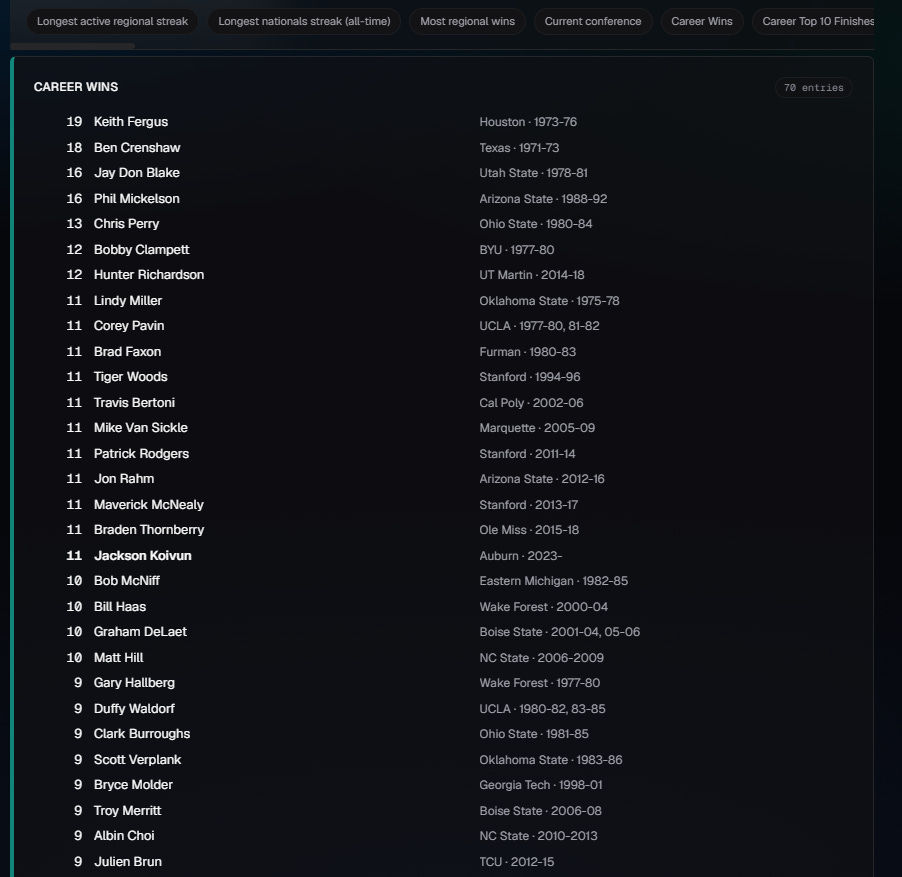
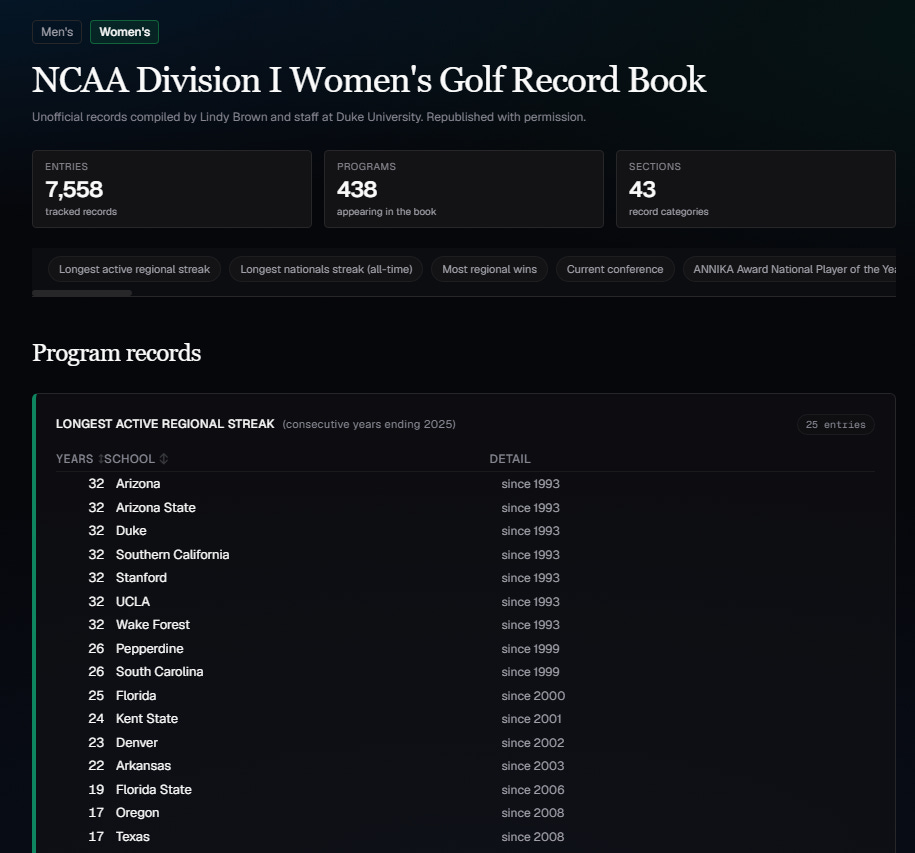
Our final section to cover today actually comes courtesy of someone else. Lindy Brown, additional Duke University SID staff members, and other contributors have been building an unofficial Men’s and Women’s D1 Golf Record Book, and have graciously given permission to share that here. We’ve kept the sections from the provided PDFs and provided some helpful navigation.
Although much time has been put in already to fill these in, these record books remain a work in progress and are continuously bolstered by additional info supplied by other SIDs and capturing results as they happen. We’re doing our best to help fill in the gaps too. All of this is in the hopes of one day having a definitive Record Book to point to when something happens such as wondering where Jackson Koivun’s career win total stacks up against other collegiate legends like Phil Mickelson, Tiger Woods, Keith Fergus, and Ben Crenshaw.
We sincerely hope that you find our site to be both useful and pleasant to navigate. We eagerly welcome any and all (constructive) suggestions for site improvement and expansion! If you have ever thought of something you wish you could see/research with college golf, please reach out. We are also taking on special projects for teams, and have some additional non-public tools in the works.
Thanks for reading and visiting collegegolfdata.com!!

Have a great week!
This tool is amazing!!!!