The 2023 Championship marked the 125th playing of men’s collegiate golf championships. As always, the tournament was full of drama and fun. Lucky bounces and bad breaks. For one team the peak of glory and for the 29 others the haunting specter of what could have been.
As soon as we crown the champion - and often even before - we start wondering “What if [this or that happened]?” It’s natural to speculate on how two teams would have matched up differently, but with golf we have the added dimension of knowing that there are several different formats which could have been used to determine the winner. This provides fertile ground for even more interesting speculation and (hopefully good-spirited) arguments. So, armed with this notion as well as the understanding that nothing happens in a vacuum so the things that happened might have happened slightly differently given fore-knowledge of a different format, we can dive into our “What if. . .?”
General Format History
College golf has a long and complicated history of format changes which we covered at length in our men’s championship history series. The format used to determine the team champion in 1939 when the NCAA took over was largely the same as had been used going back to the end of WWI, but several changes were necessitated by the outbreak of WWII. What follows is a generalized breakdown of the different time periods between major changes. Be aware though that these are just the bare details and that there were various other differences as the format was tweaked repeatedly throughout the lifetime of the event.
1939-1945 = several formats due to war-time interference
1946-1959 = 36 holes & [up to 6]-count 4 (aggregate)
1960-1967 = 36 holes & 5-count-4 (aggregate)
1968-1977 = 72 holes & 5-count-4 (aggregate)
1978-1988 = 72 holes & 5-count-4 (daily)
1989-2008 = Regional qualifier & [same as before with small tweaks]
2009-2014 = 54 holes SP (5-count-4 daily) & match play
2015-current = 72 holes SP (5-count-4 daily) & match play
For our purposes today we are looking at just the match play era 2009-2023.
Breakdown of Championship Totals
Before we get started, something needs to be made clear: we are not trying to make some grand statement, but rather the point is to see how applying other formats would have changed the outcome of the tournament. That said, there are some interesting talking points. One of the most surprising things (to me) while putting this together was the fact that over the course of 72 holes, the current format of 5-count-4 determined on a daily/per-round basis resulted in nearly the exact same list of champions as when using either the 5-count-4 aggregate (calculated at the end of the tournament) or the 5-count-5 format. This lends credence to the notion that 72 holes appears to be the superior number of holes in determining the top teams. One of the least surprising things has to be that the average GolfStat ranking was far higher when determined strictly by stroke play rather than the match play component. Somewhere in-between is the fact that Illinois, Vanderbilt, and North Carolina should absolutely have some championship rings. Imagine with us for a moment what the ripple effects might be given any of these alternate scenarios below.
Format: 5-count-4 Daily
This is the format college golfers are most familiar with, which might very well be because of the dominance of the 1974-75 Wake Forest team. There’s something undeniably poetic about 54 holes of 5-count-4 team golf, but is it fitting enough to crown a champion? After all, both 36 and 72 holes of stroke play have decided national titles but never strictly 54 holes. We explore more about the theoretical brackets being decided by 54 holes later, but for this chart here let’s see what the revised team national championship count would look like during the match play era if only stroke play was used.
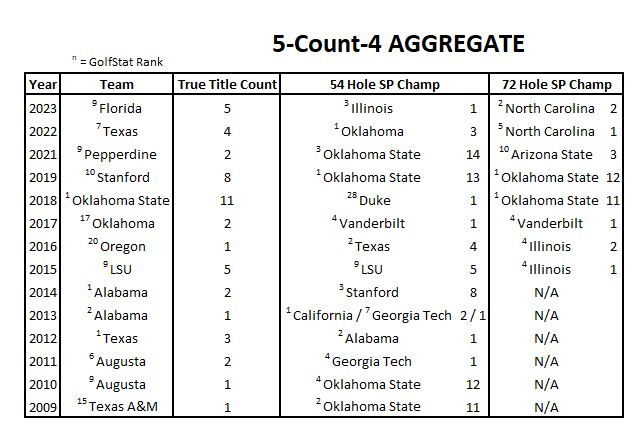
Format: 5-count-4 Aggregate
Before the move to the “daily” variant in 1978, the format always used was x-count-4 aggregate tallied at the end of the tournament, whether that was 36 or 72 holes. The chart below has many results in common with the one above, however there are some interesting differences, such as Georgia vs LSU over 54 holes in 2015 or Illinois (repeating) vs Texas over 72 holes in 2016.
Something we have to note: where teams had substitutions, we counted that as one individual in order to determine their 54 and 72 hole scores (where applicable). It may not be explicitly comparable to previous years/formats, but we feel it’s within the spirit of the substitution rule.
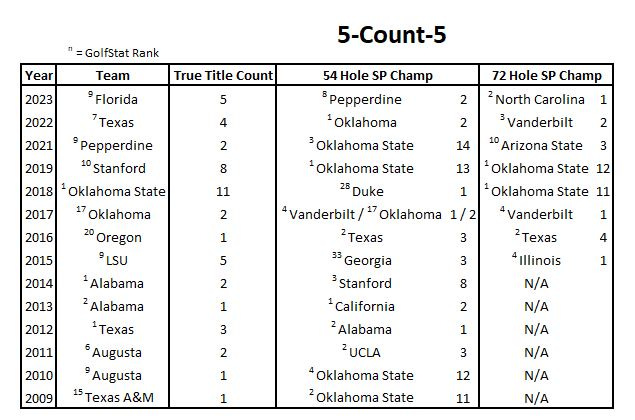
Format: 5-count-5
Finally we’re getting into some uncharted waters here with a format never used for a full championship, however 5-count-5 is used to determine sudden-death playoffs so we thought we’d see what that might look like when determining the whole thing. Once again, the overlaps are just as interesting as the differences given the notion that this format should reasonably favor the deepest teams.
Note that the same team substitution scoring manipulation is used here as was done for the 5-count-4 aggregate scoring above. There's is, however, and added consideration and a reason for the drop score beyond just someone having an off day. In the extremely rare instance where a team did not have a 5th score due to a disqualification or withdrawal (ex: this year Oregon had a player withdraw due to a freak accident), we decided to either duplicate the team’s highest score for that day or that player’s highest score for the tournament, whichever was greater. Obviously this isn’t the most scientific way to do that, but it seemed better than simply withdrawing the team. In any case, those substitutions never affected a team vying directly for the championship, which might be a topic worth exploring in depth another time.
2009 - 2023 Alternate Brackets
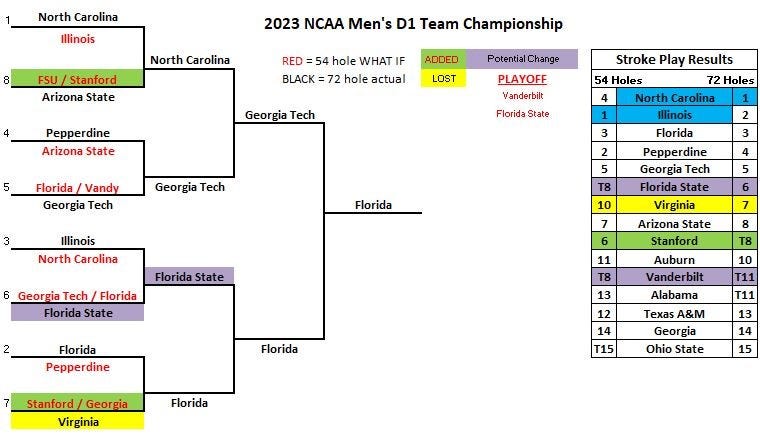
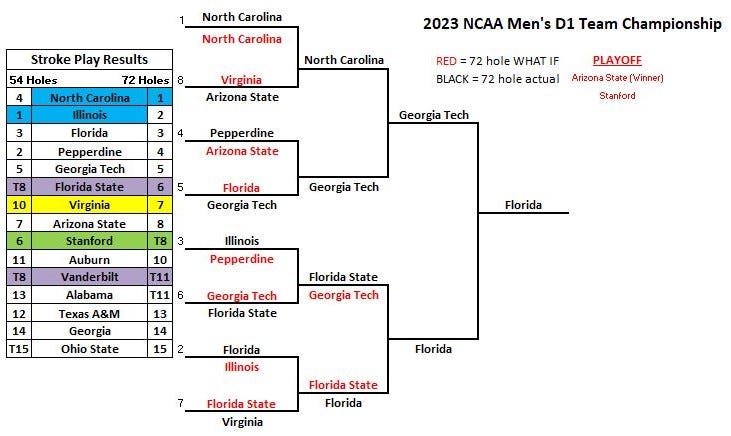
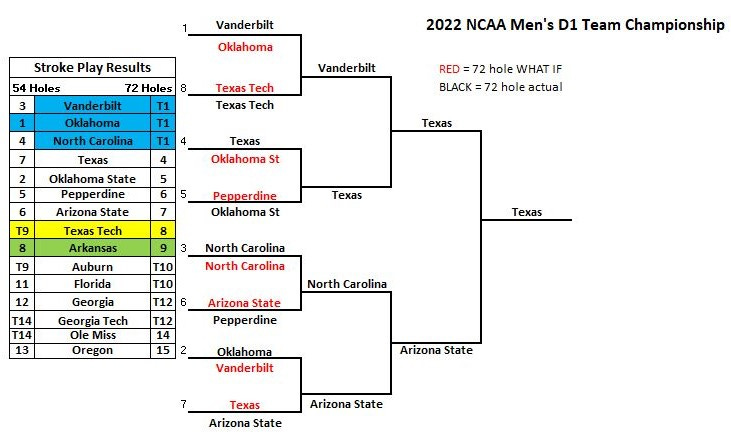
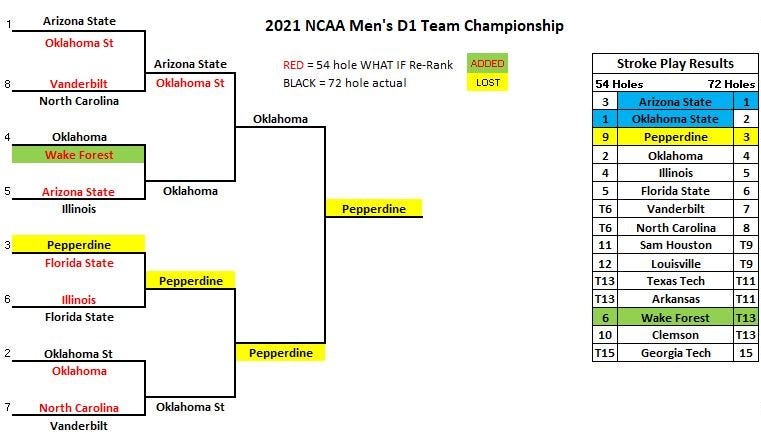
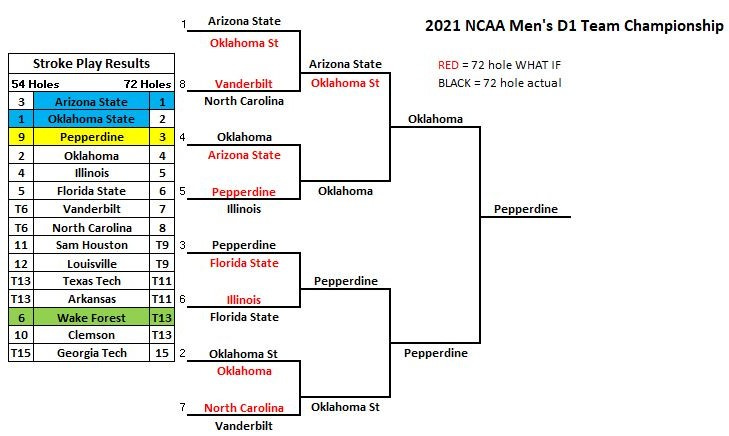
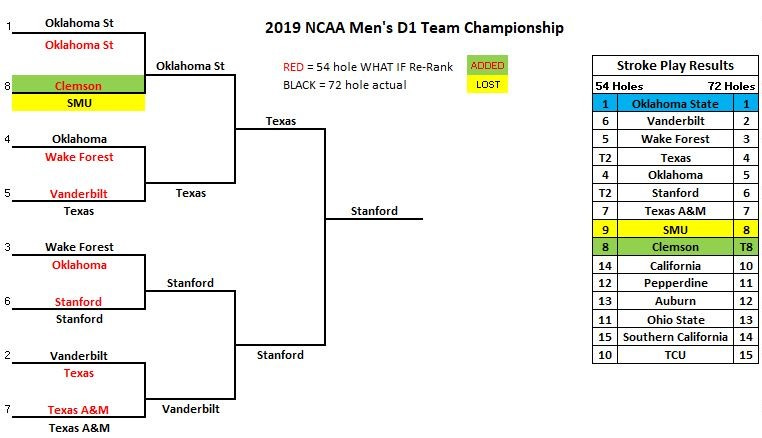
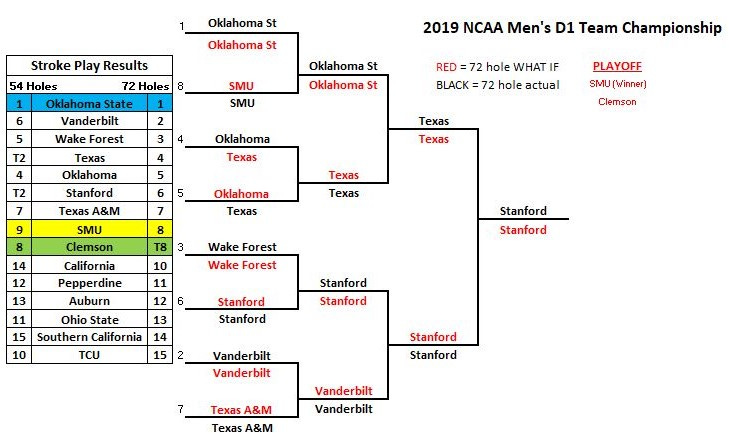
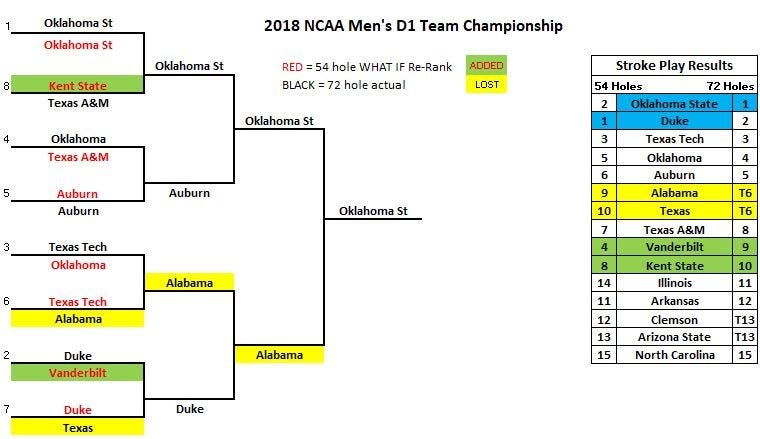
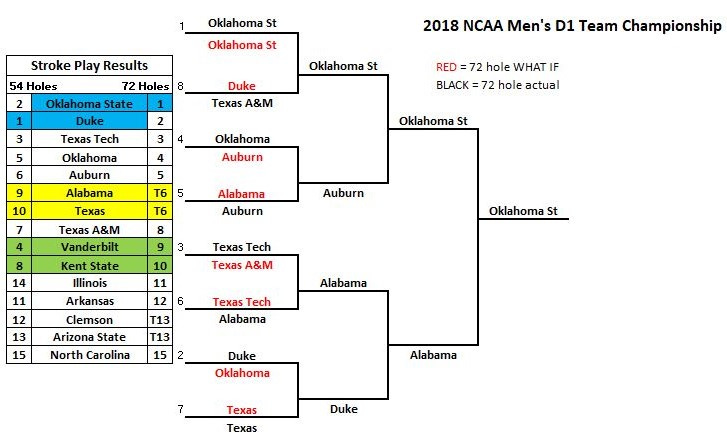
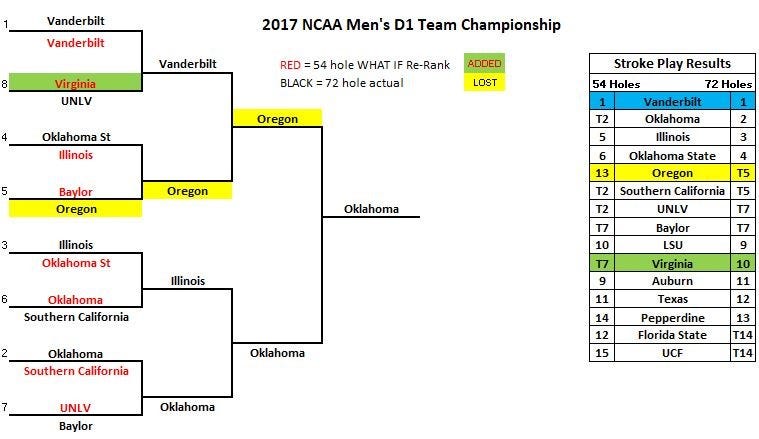
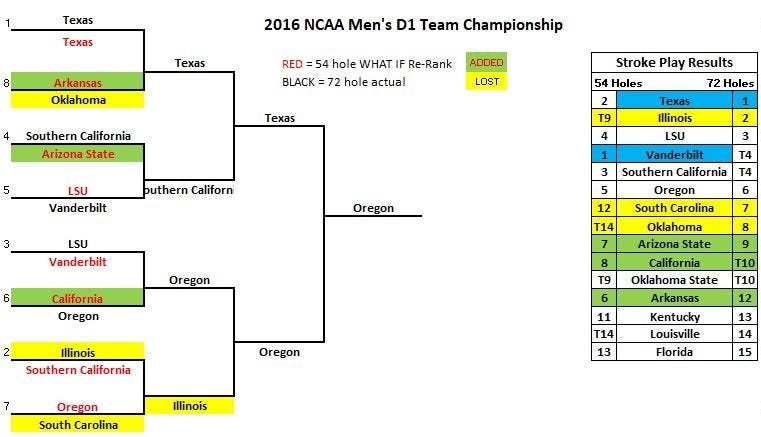
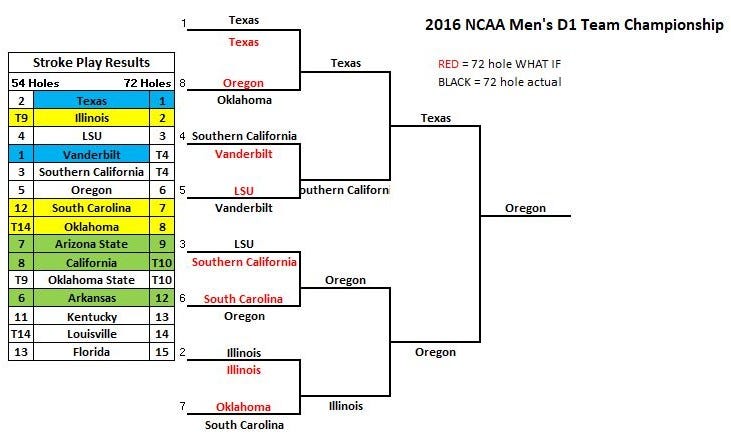
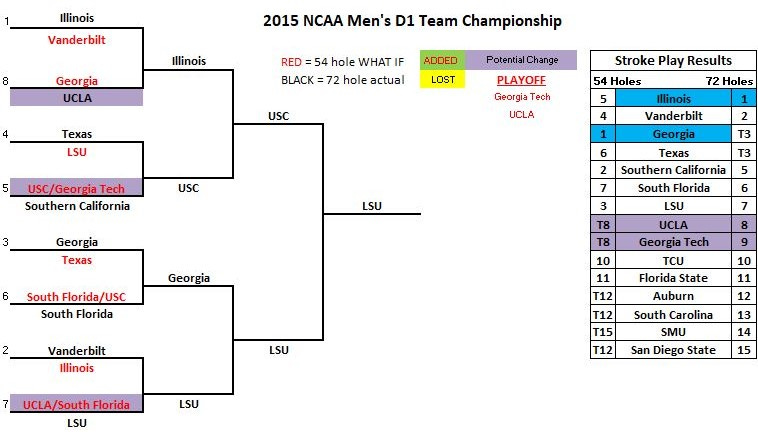
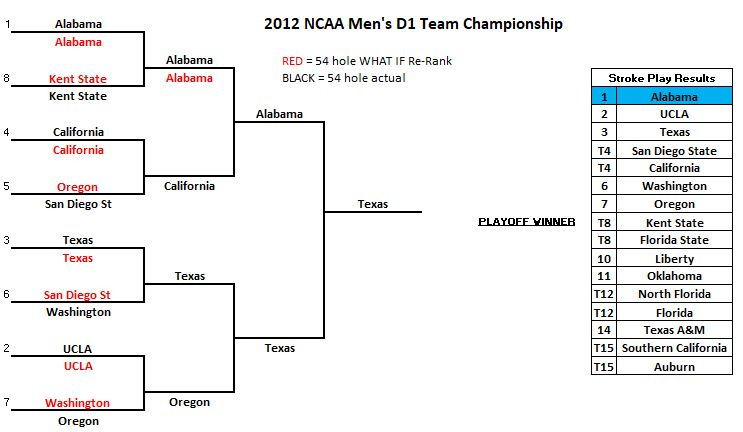
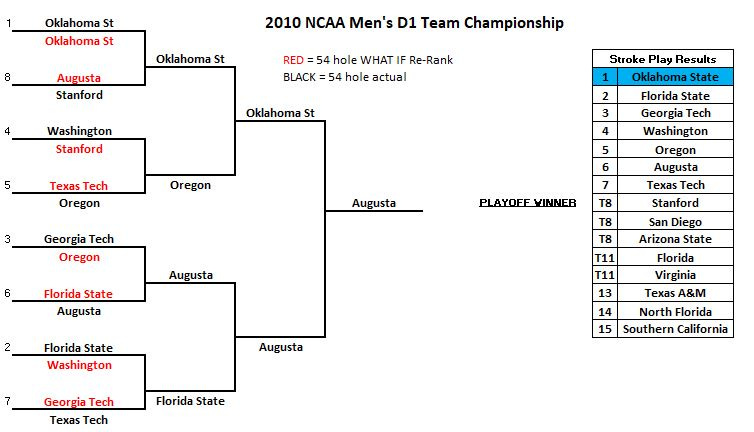
What follows is a graphical look at each of these years, broken down into 54-hole brackets and 72-hole brackets (if 72 holes were played) **using the actual 5-count-4 daily format results. We know there is A LOT of info being shown in each of these graphics, some of which my not be very clear. The main things to keep in mind:
The black text in the brackets show what actually happened while the red text shows the potential matchups
Note that in some instances the matchups are the same, so here we advanced those teams that actually won
The teams in red are seeded FIRST by their Regional rank. Since there are 6 regionals and therefore 6 of each seed, the tie-breaker is determined by their stroke play finish (up to that point) in the national championship. In the case where there was a tie after 54-holes, the “/” differentiates the two seeding scenarios where those on the left side are for team 1 winning and those on the right for team 2 winning
The color highlighting for the 54-hole brackets is meant to show what teams would have been added/lost if the bracket had been made after 54 holes instead of 72 holes. Purple highlighting is for the potential change for a team that was tied after 54 holes and therefore would have been in a playoff for that spot (which we obviously don’t know the outcome to). Finally, the blue highlighting is for the stroke play champion at both the 54-hole and 72-hole marks
So with that, here they are:
2023: Florida (5)
54 Holes: SP = Illinois, MP = ??
72 Holes: SP = North Carolina, MP = ??
2022: Texas (4)
54 Holes: SP = Oklahoma, MP = ??
72 Holes: SP = (Playoff) Vandy or Oklahoma or UNC, MP = ??
2021: Pepperdine (2)
54 Holes: SP = Oklahoma State, MP = ??
72 Holes: SP = Arizona State, MP = ??
2019: Stanford (8)
54 Holes: SP = Oklahoma State, MP = ??
72 Holes: SP = Oklahoma State, MP = **Stanford (how cool is that??)
2018: Oklahoma State (11)
54 Holes: SP = Duke, MP = ??
72 Holes: SP = Oklahoma State, MP = ??
2017: Oklahoma (2)
54 Holes: SP = Vanderbilt, MP = ??
72 Holes: SP = Vanderbilt, MP = ??
2016: Oregon (1)
54 Holes: SP = Vanderbilt, MP = ??
72 Holes: SP = Texas, MP = ??
2015: LSU (5)
54 Holes: SP = Georgia, MP = ??
72 Holes: SP = Illinois, MP = ??
2014: Alabama (2)
54 Holes: SP = Stanford, MP = ??
2013: Alabama (1)
54 Holes: SP = California, MP = ??
2012: Texas (3)
54 Holes: SP = Alabama, MP = ??
2011: Augusta (2)
54 Holes: SP = UCLA, MP = ??
2010: Augusta (1)
54 Holes: SP = Oklahoma State, MP = ??
2009: Texas A&M (1)
54 Holes: SP = Oklahoma State, MP = ??
Should we look at more?
Depending on the interest, we could certainly do this same exercise going back further. As mentioned above, there are several other periods we could look at and even see what the potential brackets may have looked like. Leave a comment below to let us know what you think or any additional thoughts or questions.
Thanks for reading!


